This webpage contains updates to the observing program described in my book “Gauging the Solar System”. The second edition is available at
The header photograph shows Mars moving between the Hyades and the Pleiades in April 2019.
The most recent updates were made on 8/14/2024.
New in 2024:
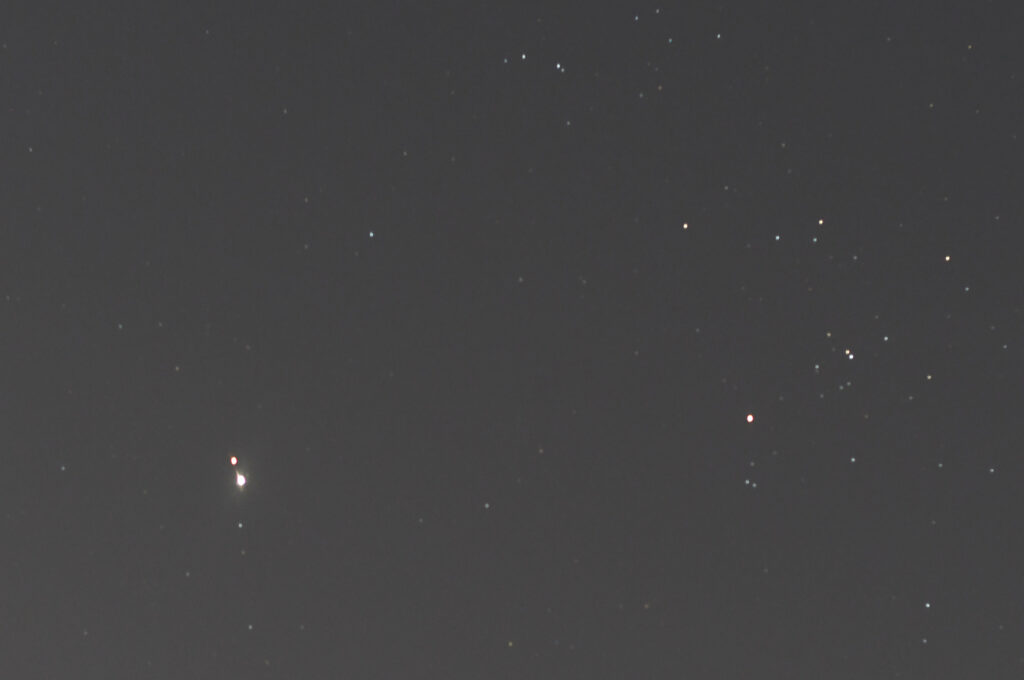
In the morning of August 14 there was a very close conjunction of Mars and Jupiter, which were only three tenths of a degree apart as they went past the Hyades. There was a bit of smoke in the atmosphere from Canadian wildfires, but it was not too bad.
New in 2022:
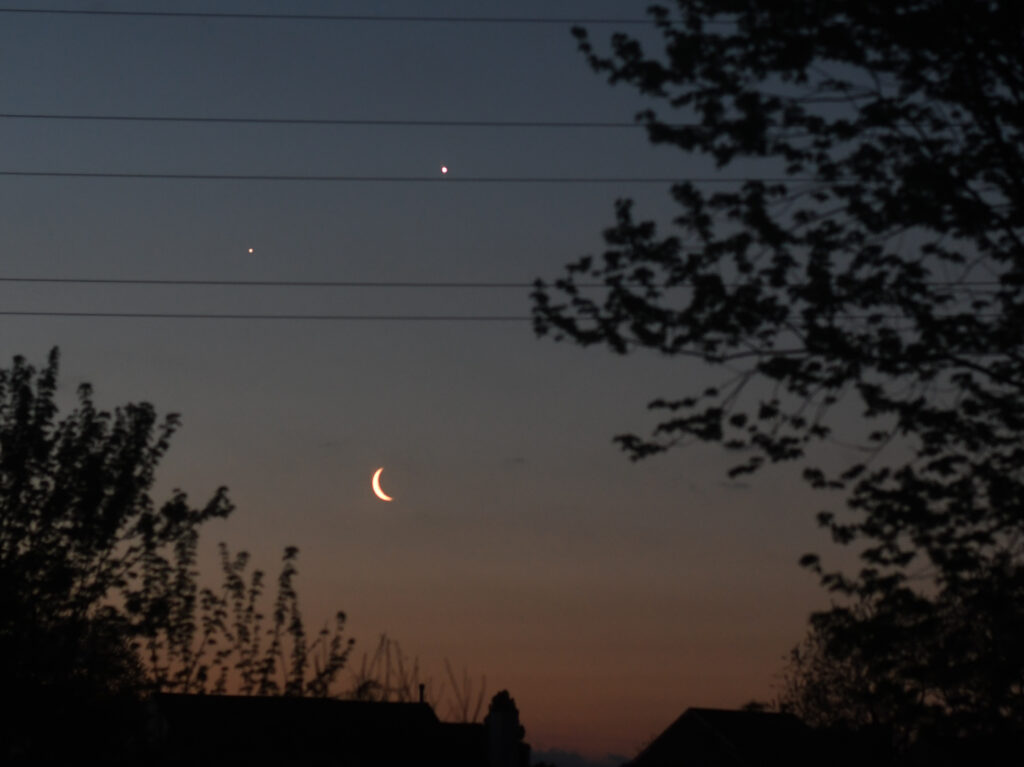
The planets Venus, Mars, Jupiter and Saturn carried out a dance during the early Spring months. In this photograph, taken on April 27, Mars and Saturn have moved up to the right but the old Moon is passing between Jupiter and Venus. There are more photographs on the Venus and Mars pages.
I completed tracking the retrograde motion of Neptune in February and analyzed the data using my usual least-squares program. The curve and the results are given on the “Outer Planets” page.
New in 2021:
As a teaser for myself, at the beginning of January I took a couple of star-field photographs of the sky around the planet Neptune and found its coordinates. I had never attempted to locate Neptune previously, Now I have to try to find it when it comes from behind the Sun. During the very bad weather of February I filled my time completing the second edition of my book, which is linked up above.
I did it! I tracked Neptune through its opposition in September and I am now following it through its retrograde loop.
Most recently I observed and photographed the almost total lunar eclipse of November 19. The pictures are on the Moon page.
New in 2020:
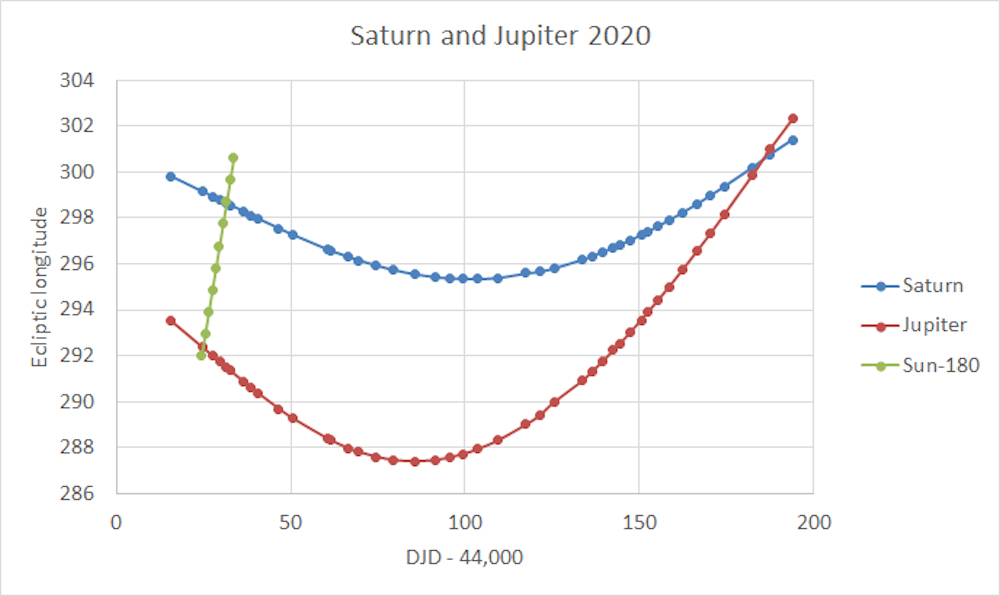
In the Fall I tracked Saturn’s moon Titan in order to find the mass of Saturn. The numbers are on the “Outer Planets” page. As a result of this, I did measure the coordinates of Saturn and Jupiter as they went through opposition and retrograde motion, so I decided to continue following them as they approached one another. The graph shows their ecliptic longitudes through opposition and their stationary points until they reached, and went through, the Great Conjunction!
The big news this summer has been the comet NEOWISE, C/ 2020 F3, so I thought I should throw in my own simple snapshot, taken on 7/18/2020:
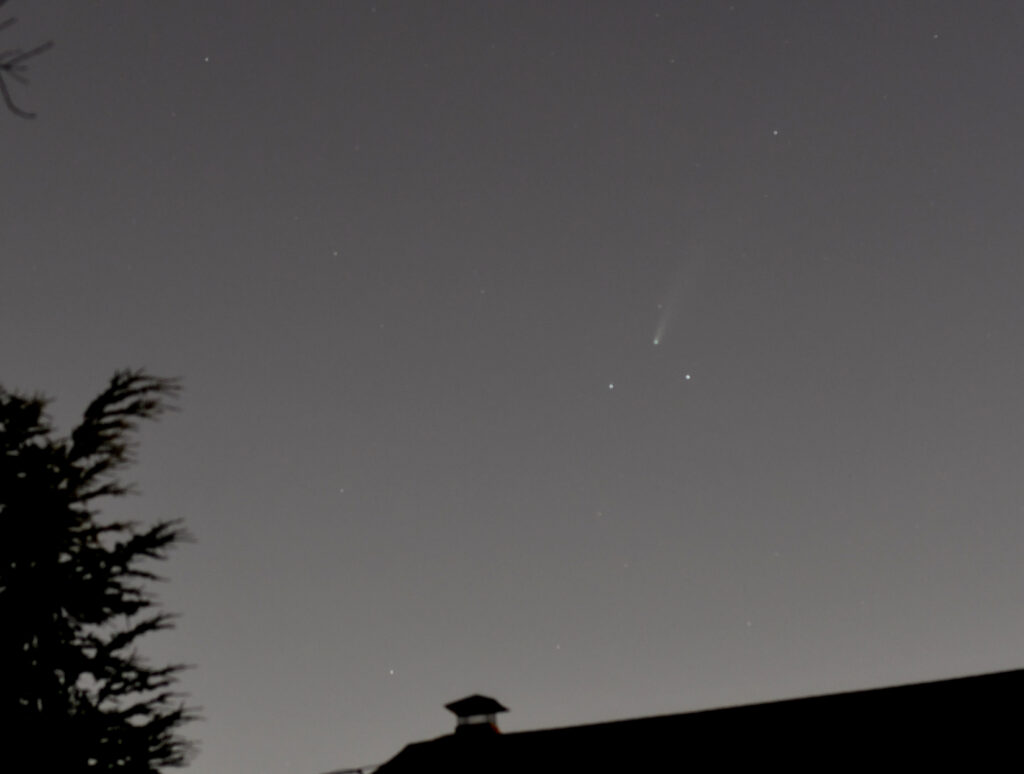
The one redeeming feature of this is that I took the photograph from the sidewalk in front of my house, so I feel that the comet came to me!
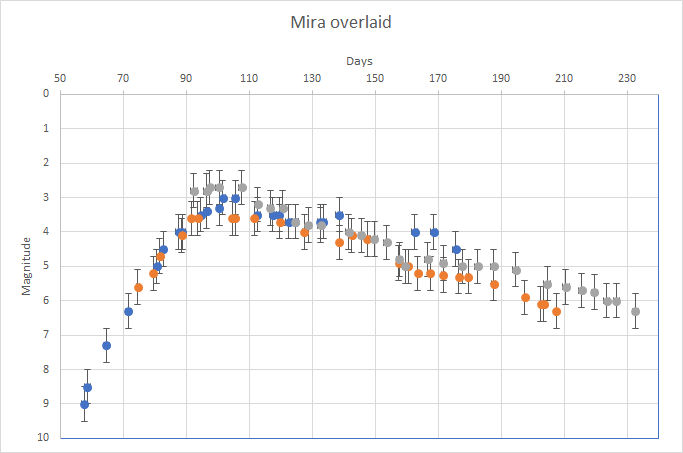
I followed Mira through a maximum for the third time. All three cycles are shown here.
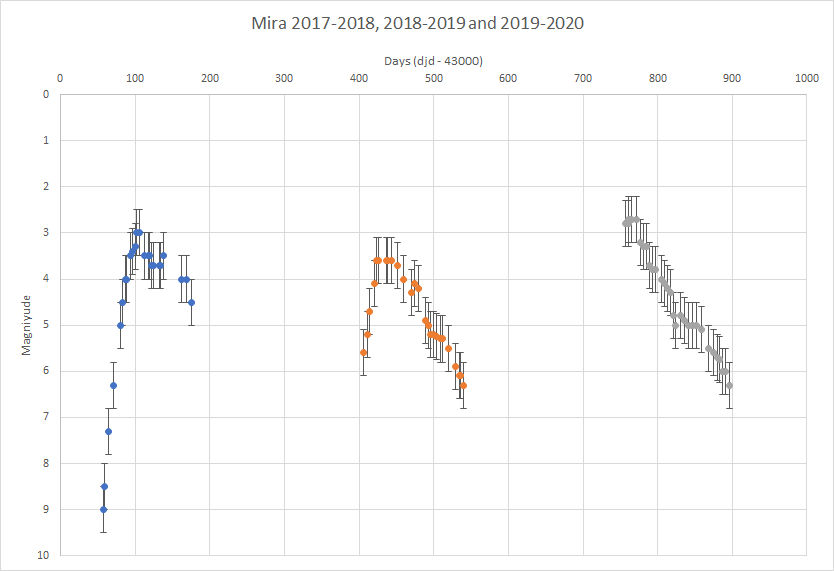
I can make a guess at the repeat period, slide the middle peak to the left by that number of days, and slide the right hand peak to the left by twice that guess. The value that seems to give the best overlap is 331 days.
New in 2019:
I watched the middle part of the transit of Mercury in front of the Sun on November 11th. I discuss this on the Mercury page.
I have begun following Mira through another brightening. Of course, Mira is conveniently in my night sky for the same period every year, but its repeat period is about eleven months. So it is a month further into its cycle each time I follow it. This time it was almost at its brightest when I made my first measurement. I judged its magnitude to be about 2.7, which is the brightest I have seen it. An advantage of this advancing through the cycle is that I should be able to follow it further through its drop in brightness as I follow it in the Spring.
The weather during the late Spring and Summer were not cooperative for my sort of measurements. Only the Moon showed itself consistently through the clouds and I was able to add points to each of my plots. The latest results are on the Moon page.
I followed Uranus through its retrograde motion for the fourth time. That is reported on the “Outer Planets” page. A surprise was that for the last few measurements Mars made an appearance in the field. In the last 14 months I have tracked Mars through near conjunctions with Jupiter, Saturn, and Uranus. I also followed Mira through a maximum. The weather was not as obliging as a year ago, but I could satisfy myself that its maximum brightness this time was about magnitude 3.6, which is not quite as bright as the previous cycle. By sliding one curve over the other in Excel I could get a value for its repeat period of 331 days. The results for all three cycles are plotted up above with the results for 2020.
New in 2018:
At the end of the year I was photographing the evening southern sky tracking Uranus through its retrograde motion and following Mira once more as it went through a maximum in its brightness. These projects will keep me busy until March next year.
My biggest project for 2018 crept up on me! The first idea was just to follow Jupiter through its retrograde motion. This started at the beginning of the year, and it turned out that Jupiter was in a very pretty close conjunction with the star Zubenelgenubi and the planet Mars. Since the first few photographs included Mars I decided that I might as well keep following it as it moved away from Jupiter. After a couple of months Mars bumped into Saturn, so several photographs included both planets. So I added Saturn to my list of objects as they moved apart. Then a club member pointed out that the asteroid Vesta was making an unusually bright appearance near Saturn. I checked my photographs and found that I already had twelve photographs of Vesta that I could analyze, and I added Vesta to the list. The catch with all of this is that I have embarked on a project that will occupy the whole year. The results for the three planets are incorporated on the appropriate pages.
The most exciting bit of all this is the measurement of the orbit of Vesta. I had never attempted to track an asteroid and I didn’t know what to expect. For the major planets I plot the ecliptic longitude as a function of time and fit a curve to extract the distance and period of the planet. But what would that plot look like for Vesta? Silly me! An asteroid is a minor PLANET and it has a typical planetary orbit of a near-ellipse satisfying Kepler’s laws. The plot is very similar to the plots for other planets, such as the plot of Mars on that page.
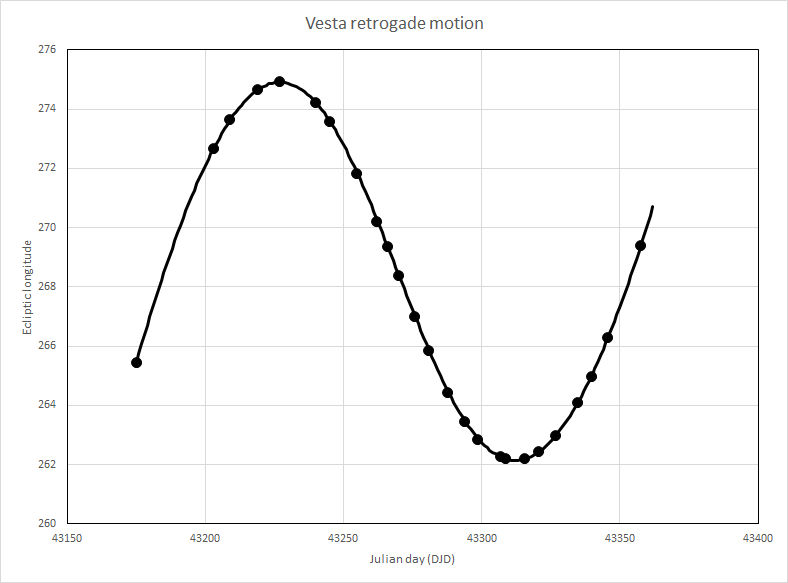
The line comes out of the fitting program, which also gives a value of 2.15 au for the distance of Vesta from the Sun at opposition, and 3.04 years for the time it would take Vesta to complete an orbit if it kept going at that speed. Using the type of argument I use for Saturn and Uranus on their page, I can estimate that the semi-major axis of Vesta is 2.3 au and that its sidereal period is about 3.5 years.
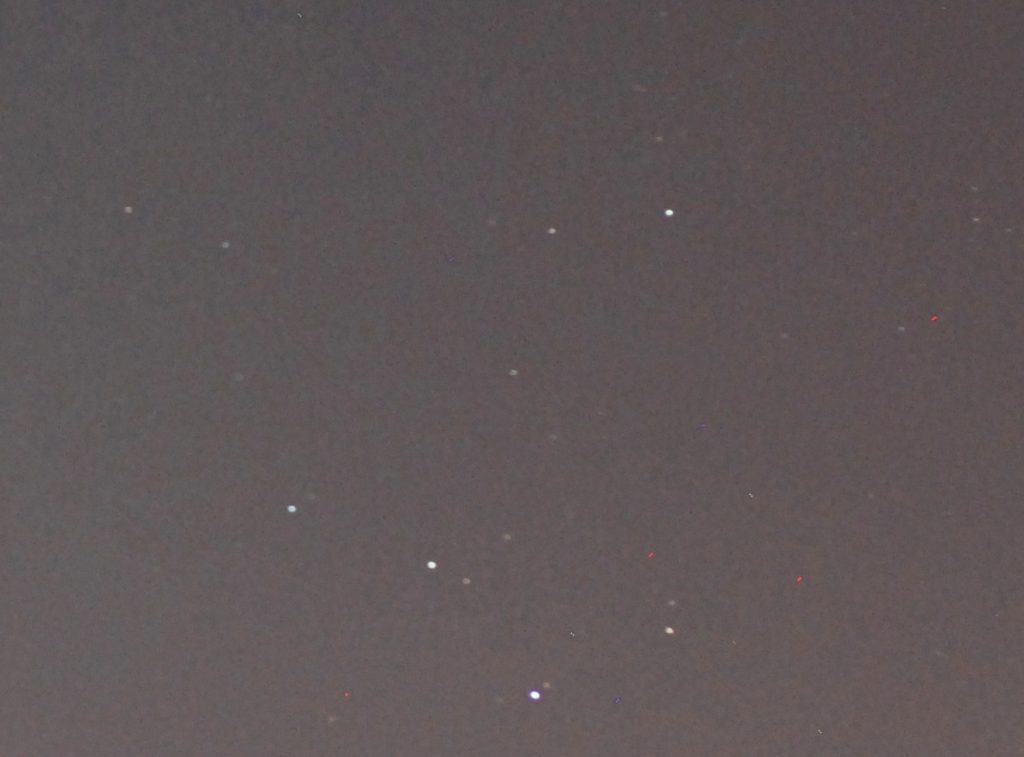
The photograph shows Vesta on 7/28/2018. Vesta is right in the center of the picture. The four brightest stars below it are c-, b-, θ-, and o-Oph. The bright star above it and to the right is ξ-Oph. The magnitude of Vesta was 6.3. I just managed to see it in my telescope.
My first project for 2018 actually started in 2017. I followed the variable star Mira as it went through a maximum. Compared with the variable stars I have tracked earlier, Mira is indeed a wonder. Its period is about eleven months instead of a few days, and it can change brightness by up to six magnitudes – a factor of about 250. Unfortunately, in my local sky it is still not naked-eye visible even at its brightest, so I resorted to taking star-field photographs and estimating the brightness of Mira by comparison with other stars in the field. I believe I could estimate the brightness to within half a magnitude.
 The first photograph was taken on November 19th 2017. In the center is a pattern of three stars, and, if you look very carefully, there is a fourth star making up a slightly skew square. This is Mira, and I estimated it to be at ninth magnitude.
 The second photograph was taken on December 26th, about five weeks later, and Mira was at its peak, close to magnitude 3. To a naked-eye observer in a dark sky, Mira would have appeared from nowhere. No wonder it was called miraculous.
At this point things went a bit wrong. Based on previous cycles, Mira should have begun to fade after a few days. Instead it kept quite close to its maximum brightness for all of January and February, and most of March. Eventually I lost it in the evening twilight. The complete plot is up above together with my 2019 and 2020 measurements.
New in 2017:
In August I took a trip to Glendo, Wyoming, with a Sky and Telescope tour, to see the August 21st total eclipse of the Sun, which was awesome. There is a souvenir photograph on the Earth and Sun page.
One of my biggest projects for 2017 was to follow Venus through its retrograde motion as it went through inferior conjunction, in front of the Sun and out again. I have described this on the Venus page.
On another front, I have modified my attitude about sextants! In my book I explained that I have been using a Davis Mark 3 sextant for almost thirty years. Because of its limitations I could measure latitudes only with a 2′ uncertainty, and this limited my calculation of the radius of the Earth to plus or minus 6%. Actually, I am still happy with that as a result in itself. My problem is that in the later parts of the book I made quite a lot of use of this value, and that 6% looked less and less acceptable. I have now upgraded to a Davis Mark 25 sextant and that looks much more powerful. I need to spend some time using it before I try to take final values, but I am hoping to cut down the uncertainties by a factor of ten. Davis are at www.davis.com
My first attempts with the new sextant are described on the “Earth and Sun” page.